微服务初探

初识为服务

什么是微服务

使用一套小服务来开发单个应用的方式,每个服务运行在独立的进程里。一般采用轻量级的通讯机制互联,并且他们可以通过自动化的方式部署。

微服务特征

单一职责(只把紧密相关的业务放在一起,无关的业务独立出来,比如订单和支付作为一个服务,登录注册作为一个服务,和其他服务不紧密的比如邮件服务,短信服务可以作为一个服务)

轻量级的通信:微服务之间的访问和通信 (平台无关和语言无关,http就是轻量级的通信协议)

隔离线:每个微服务运行在自己的进程中

有自己的数据:微服务倾向都有自己的数据存储系统,这样可以降低数据结构的复杂度

技术多样性:微服务可以由开发人员选择最适合的技术,只要提供应有的API就可以了

微服务诞生背景

  1. 互联网行业的快速发展
  2. 敏捷开发,精益方法深入人心(说白了就是频繁的修改测试上线)
  3. 容器技术的成熟

微服务的优势

独立性:微服务从构建,部署,扩容,缩容,容错,数据库都是单独管理的,所以每个服务之间都是相互独立的

敏捷性:对使用者来说,微服务暴露的接口相对简单,因为功能单一,并且有清晰的api,当有新需求时,也可以快速定位到是在哪个微服务中开发

技术栈灵活:理论上每个微服务都可以有自己独立的技术栈,不会受到其他微服务的影响

高效团队:微服务开发的人员不多,可以几个人开个小会就把需求定下来

微服务的不足

额外的工作:服务的拆分,要把我们的服务拆解成微服务。tdd领域驱动设计

数据一致性:单体架构只有一个数据库,可以使用事务来实现多表的级联的修改和删除很容易达到数据的一致性,微服务都有自己的数据库,拆分微服务的时候要尽量保证对数据库的连表操作,尽量在同一个微服务里面。但是很难保证意外的情况

沟通成本:微服务的api的改变带来的沟通成本,因为可能需要改变的地方并不仅仅只是自己的服务,还涉及到其他服务,则这个时候推动项目的前进的沟通成本很高

微服务架构引入的问题和解决方案

微服务间如何通信?

从通讯模式角度考虑

  • 一对一还是一对多?
    同步还是异步?
一对一 一对多
同步 请求响应模式,最常见 ———–(没有这样的场景)
异步 通知(不需要响应)/请求异步响应(不需要立即响应) 发布订阅/发布异步响应

从通讯协议角度考虑

REST API

1
RPC : dubbo ,grpc, thrift, motan

MQ : 消息队列,发布订阅的模式

如何选择RPC框架

I/O,线程调度模型:

是同步的IO还是非阻塞的异步IO。是长连接还是短连接。 )

是单线程还是多线程,线程的调度算法是怎么样的

序列化的方式——->通信的效率

可读的

二进制

多语言支持:是否都是一个语言开发

服务治理:服务发现和服务的监控

服务发现、部署、更新

不管微服务还是传统服务,绝大多数对外提供访问的方式是ip+port的方式.

传统服务的 “服务发现”

client—>dns服务器—>nginx轮训对应的ip和端口—->服务器

这也不算是服务发现,每次新增服务的时候,需要重新配置。

微服务的服务发现

  1. 客户端的发现

最下面有一个注册中心,当微服务启动之后,都会把自己所暴露的ip和port告诉给注册中心,然后客户端通过查询注册中心所注册的服务来得知微服务提供者的ip和port列表,然后通过本地的一些负载均衡等策略来实现对微服务的无差别访问,如果出现一些调用失败的情况,客户端也有自己的重试的规则。

dubbo和motan就是这种模式

服务端的发现

微服务还是同样的将自己的ip和port注册到注册中心,但是客户端不访问注册中心了,他不需通过注册中心指导微服务的列表,而是通过一个固有的ip去访问一个具有服务发现和负载均衡的服务,再由他将请求转发给后端的具体服务,并且将应答返回给客户端,这个服务在中间起到一个类似代理人的作用,他会从注册中心获取到具体的微服务列表,然后维护到自己的内部,然后当客户端请求一个服务的时候,他会知道客户端应该请求的是这个服务对应的哪些实例在运行,然后通过负载均衡算法去选择一个后端。

服务编排

服务编排包括,服务发现,服务更新和服务的扩缩融

流行的服务编排工具:

Mesos Docker Swarm kubernetes

redis集群安装

redis Cluster 集群安装

集群部署

测试部署方式,一台测试机多实例启动部署。

安装redis

1
2
3
4
5
$ wget http://download.redis.io/releases/redis-3.2.8.tar.gz
$ tar xzf redis-3.2.8.tar.gz
$ cd redis-3.2.8
$ yum groupinstall -y "Development Tools"
$ make && make install

修改配置文件 redis.conf

1
2
3
4
5
6
7
8
9
10
11
12
13
14
15
16
17
18
19
20
21
22
23
24
25
26
27
28
29
30
31
32
33
34
35
36
37
38
39
40
41
42
43
44
45
46
47
48
49
50
51
52
53
54
55
56
57
58
59
60
61
62
63
64
65
66
67
68
69
70
71
72
73
#redis.conf默认配置
daemonize yes #后台运行开启
pidfile /var/run/redis/redis.pid #多实例情况下需修改,指定pid文件的路径 通过绝对路径指明文件存放的位置 自行创建相关的文件目录 例如redis_6380.pid
port 6379        #多实例情况下需要修改,修改端口号 例如6380
tcp-backlog 511
bind 0.0.0.0      
timeout 0
tcp-keepalive 0
loglevel notice
logfile /var/log/redis/redis.log      #多实例情况下需要修改,例如6380.log
databases 16
save 900 1
save 300 10
save 60 10000
stop-writes-on-bgsave-error yes
rdbcompression yes
rdbchecksum yes
dbfilename dump.rdb  #多实例情况下需要修改,修改dump日志文件路径 果不修改dump文件那么每次的日志文件都是公用的 例如dump.6380.rdb
slave-serve-stale-data yes
slave-read-only yes
repl-diskless-sync no
repl-diskless-sync-delay 5
repl-disable-tcp-nodelay no
slave-priority 100
appendonly yes #启用二进制日志
appendfilename "appendonly.aof"  #多实例情况下需要修改,例如 appendonly_6380.aof
appendfsync everysec
no-appendfsync-on-rewrite no
auto-aof-rewrite-percentage 100
auto-aof-rewrite-min-size 64mb
aof-load-truncated yes
lua-time-limit 5000
slowlog-log-slower-than 10000
slowlog-max-len 128
latency-monitor-threshold 0
notify-keyspace-events ""
hash-max-ziplist-entries 512
hash-max-ziplist-value 64
list-max-ziplist-entries 512
list-max-ziplist-value 64
set-max-intset-entries 512
zset-max-ziplist-entries 128
zset-max-ziplist-value 64
hll-sparse-max-bytes 3000
activerehashing yes
client-output-buffer-limit normal 0 0 0
client-output-buffer-limit slave 256mb 64mb 60
client-output-buffer-limit pubsub 32mb 8mb 60
hz 10

#################自定义配置
#系统配置
#vim /etc/sysctl.conf
#vm.overcommit_memory = 1

aof-rewrite-incremental-fsync yes
maxmemory 4096mb
maxmemory-policy allkeys-lru
dir /opt/redis/data      #多实例情况下需要修改,例如/data/6380

#集群配置
cluster-enabled yes #启用集群
cluster-config-file /opt/redis/6380/nodes.conf #多实例情况下需要修改,例如/6380/
cluster-node-timeout 5000 #集群超时时间


#从ping主间隔默认10秒
#复制超时时间
#repl-timeout 60

#远距离主从
#config set client-output-buffer-limit "slave 536870912 536870912 0"
#config set repl-backlog-size 209715200

拷贝redis.conf文件到文件夹中

cp redis.conf 7000/redis-7000.conf

mkdir 7000 7001 7002 7003 7004 7005

将配置文件分别拷贝到7001-7008中,需要修改端口号即可.

在vim下执行以下命令可以先将文件中的全部7000修改为7001

:%s/7000/7001/g 注:代表将当前文本的所有的7000替换成7001

分别将7002-7008的配置文件进行修改

.创建shell脚本文件启动多个redis服务从7000-7008

1
2
3
4
5
6
7
8
9
10
#!/bin/sh
redis-server 7000/redis-7000.conf &
redis-server 7001/redis-7001.conf &
redis-server 7002/redis-7002.conf &
redis-server 7003/redis-7003.conf &
redis-server 7004/redis-7004.conf &
redis-server 7005/redis-7005.conf &
redis-server 7006/redis-7006.conf &
redis-server 7007/redis-7007.conf &
redis-server 7008/redis-7008.conf &

创建redis-cluster

通过redis-trib.rb来创建redis集群,

1、安装的ruby,通过yum 源下载安装的ruby可能版本过低,导致:

输入命令 “ gem install redis “ 出现 “ ERROR: Error installing redis redis requires Ruby version >= 2.2.2. “

所以要安装ruby的RVM管理工具获取ruby的最新包

使用curl安装rvm ,输入命令 “ curl -L get.rvm.io | bash -s stable “ 进行安装,这个时候可能会出现

1
GPG signature verification failed for ‘/usr/local/rvm/archives/rvm-1.29.3.tgz‘ - ‘https://github.com/rvm/rvm/releases/download/1.29.3/1.29.3.tar.gz.asc‘! Try to install GPG v2 and then fetch the public key:

这时候要输入密钥 gpg2 --recv-keys 409B6B1796C275462A1703113804BB82D39DC0E3

然后在执行

1
2
curl -L get.rvm.io | bash -s stable
source /usr/local/rvm/scripts/rvm

查看rvm中管理的所有ruby版本,
输入命令 rvm list known进行查询,查询出来如下

1
2
3
4
5
6
7
8
9
10
11
12
13
14
15
16
17
18
19
20
21
22
23
24
25
26
27
28
29
30
31
32
33
34
35
36
37
38
39
40
41
42
43
44
45
46
47
48
49
50
51
52
53
54
55
# MRI Rubies
[ruby-]1.8.6[-p420]
[ruby-]1.8.7[-head] # security released on head
[ruby-]1.9.1[-p431]
[ruby-]1.9.2[-p330]
[ruby-]1.9.3[-p551]
[ruby-]2.0.0[-p648]
[ruby-]2.1[.10]
[ruby-]2.2[.7]
[ruby-]2.3[.4]
[ruby-]2.4[.1]
ruby-head

# for forks use: rvm install ruby-head-<name> --url https://github.com/github/ruby.git --branch 2.2

# JRuby
jruby-1.6[.8]
jruby-1.7[.27]
jruby[-9.1.13.0]
jruby-head

# Rubinius
rbx-1[.4.3]
rbx-2.3[.0]
rbx-2.4[.1]
rbx-2[.5.8]
rbx-3[.84]
rbx-head

# Opal
opal

# Minimalistic ruby implementation - ISO 30170:2012
mruby-1.0.0
mruby-1.1.0
mruby-1.2.0
mruby-1[.3.0]
mruby[-head]

# Ruby Enterprise Edition
ree-1.8.6
ree[-1.8.7][-2012.02]

# Topaz
topaz

# MagLev
maglev[-head]
maglev-1.0.0

# Mac OS X Snow Leopard Or Newer
macruby-0.10
macruby-0.11
macruby[-0.12]
macruby-nightly

选择一个你喜欢的版本进行安装,但首先提醒一下,你所选择的版本不能低于 “ 2.0.0 “ 就可以了,输入命令 “ rvm install 2.3.4 “ 进行安装,如下

1
2
3
4
5
6
7
8
9
10
11
12
13
14
15
16
17
18
19
20
21
22
23
[root@VM_0_12_centos ~]# rvm install 2.3.4
Searching for binary rubies, this might take some time.
Found remote file https://rvm_io.global.ssl.fastly.net/binaries/centos/7/x86_64/ruby-2.3.4.tar.bz2
Checking requirements for centos.
Installing requirements for centos.
Installing required packages: libffi-devel, readline-devel, sqlite-devel, zlib-devel, libyaml-devel, openssl-devel.............
Requirements installation successful.
ruby-2.3.4 - #configure
ruby-2.3.4 - #download
% Total % Received % Xferd Average Speed Time Time Time Current
Dload Upload Total Spent Left Speed
100 25.2M 100 25.2M 0 0 461k 0 0:00:55 0:00:55 --:--:-- 225k
No checksum for downloaded archive, recording checksum in user configuration.
ruby-2.3.4 - #validate archive
ruby-2.3.4 - #extract
ruby-2.3.4 - #validate binary
ruby-2.3.4 - #setup
ruby-2.3.4 - #gemset created /usr/local/rvm/gems/ruby-2.3.4@global
ruby-2.3.4 - #importing gemset /usr/local/rvm/gemsets/global.gems..............................
ruby-2.3.4 - #generating global wrappers........
ruby-2.3.4 - #gemset created /usr/local/rvm/gems/ruby-2.3.4
ruby-2.3.4 - #importing gemsetfile /usr/local/rvm/gemsets/default.gems evaluated to empty gem list
ruby-2.3.4 - #generating default wrappers........

redis-trib.rb命令与redis-cli命令放置在同一个目录中,可全路径执行或者创建别名。

redis-trib.rb create –replicas 1 127.0.0.1:7000 127.0.0.1:7001 127.0.0.1:7002 127.0.0.1:7003 127.0.0.1:7004 127.0.0.1:70005

–replicas 1 表示一主一从,

脚本使用帮助

  • 查看脚本帮助
1
2
3
4
5
6
7
8
9
10
11
12
13
14
15
16
17
18
19
20
21
22
23
24
25
26
27
28
29
30
31
32
33
34
35
36
37
$ ruby redis-trib.rb help
Usage: redis-trib <command> <options> <arguments ...>

create host1:port1 ... hostN:portN
--replicas <arg>
check host:port
info host:port
fix host:port
--timeout <arg>
reshard host:port
--from <arg>
--to <arg>
--slots <arg>
--yes
--timeout <arg>
--pipeline <arg>
rebalance host:port
--weight <arg>
--auto-weights
--use-empty-masters
--timeout <arg>
--simulate
--pipeline <arg>
--threshold <arg>
add-node new_host:new_port existing_host:existing_port
--slave
--master-id <arg>
del-node host:port node_id
set-timeout host:port milliseconds
call host:port command arg arg .. arg
import host:port
--from <arg>
--copy
--replace
help (show this help)

For check, fix, reshard, del-node, set-timeout you can specify the host and port of any working node in the cluster.
  • 各选项详解
1
2
3
4
5
6
7
8
9
10
11
1、create:创建集群
2、check:检查集群
3、info:查看集群信息
4、fix:修复集群
5、reshard:在线迁移slot
6、rebalance:平衡集群节点slot数量
7、add-node:将新节点加入集群
8、del-node:从集群中删除节点
9、set-timeout:设置集群节点间心跳连接的超时时间
10、call:在集群全部节点上执行命令
11、import:将外部redis数据导入集群

codis安装及配置

codis安装及配置

一、环境安装

系统环境centos

  1. Golang 环境搭建: yum install go

  2. codis 下载和编译:

    go get -u -d github.com/CodisLabs/codis
    cd $GOPATH/src/github.com/CodisLabs/codis
    make
    make gotest
    mkdir -p /usr/local/codis/{logs,conf,scripts}
    cp –rf bin /usr/local/codis/
    cp config.ini /usr/local/codis/conf/

  1. Codis-HA 编译
    Codis-HA。这是一个通过 Codis 开放的 api 实现自动切换主从的工具。该工具会在检测
    到 master 挂掉的时候将其下线并选择其中一个 slave 提升为 master 继续提供服务。
    go get github.com/ngaut/codis-ha
    cd codis-ha
    go build
    codis-ha –codis-config=localhost:18087 –productName=test

  2. Zookeeper集群搭建

    首先安装开发工具及openjdk,zookeeper是由Java语言开发的,所以需要openjdk环境。

首先安装开发工具及openjdk,zookeeper是由Java语言开发的,所以需要openjdk环境。

1
2
3
yum groupinstall "Development tools" "Compatibility libraries" -y 
yum install openssl-devel openssl -y
yum install java-1.8.0-openjdk-devel java-1.8.0-openjdk -y

确定Java运行环境正常

1
2
3
4
java -version
openjdk version "1.8.0101"
OpenJDK Runtime Environment (build 1.8.0101-b13)
OpenJDK 64-Bit Server VM (build 25.101-b13, mixed mode)

安装二进制版本的zookeeper

1
2
3
4
tar xvf zookeeper-3.4.9.tar.gz -C /usr/local/ 
ln -s /usr/local/zookeeper-3.4.9/ /usr/local/zookeeper
cd /usr/local/zookeeper/conf
cp zoo_sample.cfg zoo.cfg

编译zookeeper配置文件/usr/local/zookeeper/conf/zoo.cfg

1
2
3
4
5
6
7
8
9
10
11
maxClientCnxns=60
tickTime=2000
initLimit=10
syncLimit=5
dataDir=/data/zookeeper/db
dataLogDir=/data/zookeeper/log
clientPort=2181
# cluster configure
server.1=10.173.225.60:2888:3888
server.2=10.174.33.81:2888:3888
server.3=10.173.224.34:2888:3888
1
mkdir /data/zookeeper/{db,log} -p

其中2888表示zookeeper程序监听端口,3888表示zookeeper选举通信端口。

下面需要生成ID,这里需要注意,myid对应的zoo.cfg的server.ID,比如第二台zookeeper主机对应的myid应该是2,以此类推,三个主机分别为:

1
2
3
10.173.225.60 echo 1 > /data/zookeeper/db/myid
10.174.33.81 echo 2 > /data/zookeeper/db/myid
10.173.224.34 echo 3 > /data/zookeeper/db/myid

然后输出环境变量。

1
2
export PATH=$PATH:/usr/local/zookeeper/bin/
source /etc/profile

然后就可以启动zookeeper了。

1
zkServer.sh start

查看各个zookeeper节点的状态(会有一个leader节点,两个follower节点)。

1
2
3
4
5
6
[root@node1 ~]# zkServer.sh status 
Mode: follower
[root@node2 ~]# zkServer.sh status
Mode: leader
[root@node3 ~]# zkServer.sh status
Mode: follower

客户端连接,可以查看相关信息。

1
zkCli.sh -server 127.0.0.1:2181

至此,zookeeper已经搞定了。

二、启动服务

再编译后的codis文件夹下有启动服务的脚本

启动codis-dashboard

使用 codis-dashboard-admin.sh 脚本启动 dashboard,并查看 dashboard 日志确认启动是否有异常。

dashboard只需要启动一个

配置文件dashboard.toml

1
2
3
4
5
6
7
8
9
10
11
12
13
14
15
# Set Coordinator, only accept "zookeeper" & "etcd" & "filesystem".
# for zookeeper/etcd, coorinator_auth accept "user:password"
# Quick Start
coordinator_name = "zookeeper"
coordinator_addr = "10.173.225.60:2181,10.174.33.81:2181,10.173.224.34:2181"
#coordinator_name = "zookeeper"
#coordinator_addr = "127.0.0.1:2181"
#coordinator_auth = ""

# Set Codis Product Name/Auth.
product_name = "codis-demo"
product_auth = ""

# Set bind address for admin(rpc), tcp only.
admin_addr = "0.0.0.0:18080"
1
2
./admin/codis-dashboard-admin.sh start
tail -100 ./log/codis-dashboard.log.2017-04-08

启动codis-fe

1
./bin/codis-admin --dashboard-list --zookeeper=127.0.0.1:2181 | tee $Gopath/src/github.com/CodisLabs/codis/config/codis.json

codis.json

1
2
3
4
5
6
[
{
"name": "codis-demo",
"dashboard": "10.174.33.81:18080"
}
]

启动codis-fe

1
2
nohup `which codis-fe` --ncpu=2 --log=/data/codis/log/fe.log --log-level=WARN 
--dashboard-list=$Gopath/src/github.com/CodisLabs/codis/config/codis.json --listen=0.0.0.0:8080 &

启动codis-proxy

使用 codis-proxy-admin.sh 脚本启动 codis-proxy,并查看 proxy 日志确认启动是否有异常。(代理可以启动一个,也可以启动多个,但是启动的多个代理的配置必须是一样的,是同一个dashboard的地址)

配置文件proxy.toml

19 # Set bind address for admin(rpc), tcp only.

20 admin_addr = “10.173.225.60:11080”
21
22 # Set bind address for proxy, proto_type can be “tcp”, “tcp4”, “tcp6”, “unix” or “unixpacket”.
23 proto_type = “tcp4”
24 proxy_addr = “10.173.225.60:19000”
26 # Set jodis address & session timeout
27 # 1. jodis_name is short for jodis_coordinator_name, only accept “zookeeper” & “etcd”.
28 # 2. jodis_addr is short for jodis_coordinator_addr
29 # 3. jodis_auth is short for jodis_coordinator_auth, for zookeeper/etcd, “user:password” is accepted.
30 # 4. proxy will be registered as node:
31 # if jodiscompatible = true (not suggested):32 # /zk/codis/db{PRODUCT_NAME}/proxy-{HASHID} (compatible with Codis2.0)
33 # or else
34 # /jodis/{PRODUCT_NAME}/proxy-{HASHID}
35 jodis_name = “”
3 # jodis_addr不能写地址,不然启动报错,不知道为啥,可能没有安装jodis,
36 jodis_addr = “”
37 jodis_auth = “”
38 jodis_timeout = “20s”

1
2
./admin/codis-proxy-admin.sh start
tail -100 ./log/codis-proxy.log.2017-04-08

要启动多个代理需要修改脚本

vi codis-proxy-admin.sh

1
CODIS_DASHBOARD_ADDR="10.173.225.60:18080"

启动codis-server

使用 codis-server-admin.sh 脚本启动 codis-server,并查看 redis 日志确认启动是否有异常。

配置redis.conf 和sentinel.conf

redis.conf

48 # bind 127.0.0.1 ::1
49 #
50 # WARNING If the computer running Redis is directly exposed to the
51 # internet, binding to all the interfaces is dangerous and will expose the
52 # instance to everybody on the internet. So by default we uncomment the
53 # following bind directive, that will force Redis to listen only into
54 # the IPv4 lookback interface address (this means Redis will be able to
55 # accept connections only from clients running into the same computer it
56 # is running).
57 #
58 # IF YOU ARE SURE YOU WANT YOUR INSTANCE TO LISTEN TO ALL THE INTERFACES
59 # JUST COMMENT THE FOLLOWING LINE.
60 # ~~
61 bind 0.0.0.0
…….
…….
82 # Accept connections on the specified port, default is 6379 (IANA #815344).
83 # If port 0 is specified Redis will not listen on a TCP socket.
84 port 6379

sentinel.conf

48 # bind 127.0.0.1 ::1
49 #
50 # WARNING If the computer running Redis is directly exposed to the
51 # internet, binding to all the interfaces is dangerous and will expose the
52 # instance to everybody on the internet. So by default we uncomment the
53 # following bind directive, that will force Redis to listen only into
54 # the IPv4 lookback interface address (this means Redis will be able to
55 # accept connections only from clients running into the same computer it
56 # is running).
57 #
58 # IF YOU ARE SURE YOU WANT YOUR INSTANCE TO LISTEN TO ALL THE INTERFACES
59 # JUST COMMENT THE FOLLOWING LINE.
60 #~~
61 bind 0.0.0.0
…….
…….
82 # Accept connections on the specified port, default is 6379 (IANA #815344).
83 # If port 0 is specified Redis will not listen on a TCP socket.
84 port 26379

1
2
./admin/codis-server-admin.sh start
tail -100 /tmp/redis_6379.log

redis.conf 配置中 pidfile、logfile 默认保存在 /tmp 目录,若启动失败,请检查当前用户是否有该目录的读写权限。

通过fe添加group

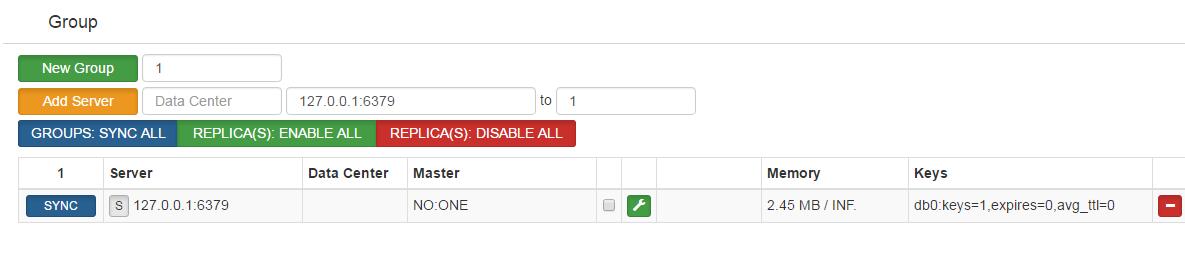
通过web浏览器访问集群管理页面(fe地址:127.0.0.1:8080) 选择我们刚搭建的集群 codis-demo,在 Proxy 栏可看到我们已经启动的 Proxy, 但是 Group 栏为空,因为我们启动的 codis-server 并未加入到集群 添加 NEW GROUPNEW GROUP 行输入 1,再点击 NEW GROUP 即可 添加 Codis Server,Add Server 行输入我们刚刚启动的 codis-server 地址,添加到我们刚新建的 Group,然后再点击 Add Server 按钮即可,如下图所示
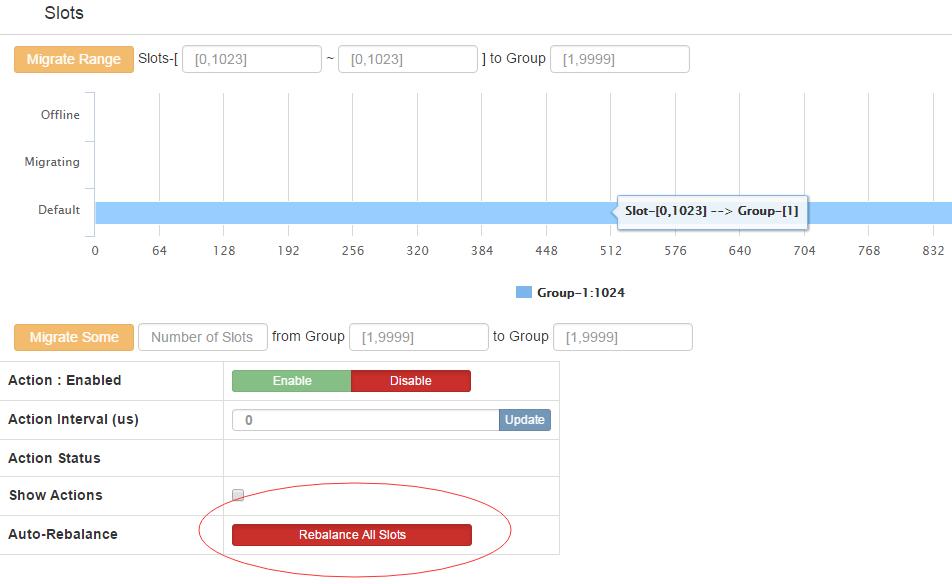
通过fe初始化slot

新增的集群 slot 状态是 offline,因此我们需要对它进行初始化(将 1024 个 slot 分配到各个 group),而初始化最快的方法可通过 fe 提供的 rebalance all slots 按钮来做,如下图所示,点击此按钮,我们即快速完成了一个集群的搭建。

每次增加组之后就需要重新执行Rebalance All Slots

Go性能分析工具

为什么需要性能分析

作为开发,一般在开发过程大多是为了功能的实现和单元测试,当业务量不大的时候,也不会说去过早的分析代码的性能。但是一旦业务量上来,原有开发中代码写的不太好的地方会造成性能瓶颈,这个时候就得需要性能分析工具帮助分析程序在哪块代码上出现了性能瓶颈。才可以有针对性的优化代码。

很幸运的,go语言官方有提供的性能工具pprof,我们可以很方便的分析程序运行过程中造成瓶颈的地方

pprof

什么是pprof

pprof是Go语言内置的标准方法用来调试Go程序性能。golang官方有提供两种pprof启动的方式,分别是 runtime/pprofnet/http/pprof ,它能提取出来应用程序的CPU和内存数据,此外还有运行的代码行数和内容信息。

pprof文件生成

runtime/pprof

此包是方便不是提供web服务的后端程序来进行分析性能

1
2
3
4
5
6
7
8
9
10
11
12
13
14
15
16
17
18
19
20
21
22
23
24
25
26
27
28
29
30
31
32
33
34
35
36
37
38
func main() {
f, err := os.Create(fmt.Sprintf("cpu-%s.pprof", time.Now().Format("20060102")))
if err != nil {
log.Fatal("create CPU profile error: ", err)
}
if err := pprof.StartCPUProfile(f); err != nil {
log.Fatal("start CPU profile error: ", err)
}
defer pprof.StopCPUProfile()

go func() {
doSth()
}()
//优雅退出
sigChan := make(chan os.Signal)
exitChan := make(chan struct{})
signal.Notify(sigChan, os.Interrupt, syscall.SIGTERM)
log.Printf("signal received", <-sigChan)

go func() {
if err := server.Stop(); err != nil {
log.Fatal(err)
}
exitChan <- struct{}{}
}()
select {
case <-exitChan:
case s := <-sigChan:
log.Panicln("signal received, stopping immediately", s)
}
}

func doSth() {
for {
rand.Float32()
time.Sleep(500 * time.Millisecond)
}
}

此时运行程序会生成关于cpu统计的文件cpu-20170823.pprof

然后通过命令执行

1
2
3
4
5
6
~ go tool pprof .\cpu-20170823.pprof
Type: cpu
Time: Jul 19, 2018 at 5:31pm (CST)
Duration: 58.32s, Total samples = 0
Entering interactive mode (type "help" for commands, "o" for options)
(pprof)

然后就可以在pprof下使用命令了

可以通过go tool pprof命令查看pprof支持哪些命令。

runtime/pprof的缺点是必须将程序关闭或者设置信号量来停止pprof的输出,这样才可以使用生产的pprof文件

net/http/pprof

对专门提供web服务的程序可以使用此包,可以方便的测试应用程序的性能

要使用net/http/pprof包很简单,在main.go文件导入包的时候,通过_ "net/http/pprof"方式导入,其实看pprof.go的文件就能知道,实现的原理。

1
2
3
4
5
6
7
func init() {
http.HandleFunc("/debug/pprof/", Index)
http.HandleFunc("/debug/pprof/cmdline", Cmdline)
http.HandleFunc("/debug/pprof/profile", Profile)
http.HandleFunc("/debug/pprof/symbol", Symbol)
http.HandleFunc("/debug/pprof/trace", Trace)
}

通过浏览器分析

pprof.go中最开始先申明一个init函数,这里申明了五个HandleFunc对应的可以在浏览器中可以打开着五个页面

/debug/pprof/页面是首页,可以查看go程序的堆栈、goroutine、线程等信息

一般如果要获取cpu的信息,生成pprof文件,则直接访问/debug/pprof/profile

通过代码:

1
2
3
4
5
6
7
8
9
10
11
12
13
14
15
16
17
18
19
func Profile(w http.ResponseWriter, r *http.Request) {
sec, _ := strconv.ParseInt(r.FormValue("seconds"), 10, 64)
if sec == 0 {
sec = 30
}
········
if err := pprof.StartCPUProfile(w); err != nil {
// StartCPUProfile failed, so no writes yet.
// Can change header back to text content
// and send error code.
w.Header().Set("Content-Type", "text/plain; charset=utf-8")
w.Header().Set("X-Go-Pprof", "1")
w.WriteHeader(http.StatusInternalServerError)
fmt.Fprintf(w, "Could not enable CPU profiling: %s\n", err)
return
}
sleep(w, time.Duration(sec)*time.Second)
pprof.StopCPUProfile()
}

可以看出Profile函数接收一个cpu收集时间,是按秒为单位收集的,如果,不填的话,默认是30秒的收集时间.

所以想自定义程序收集cpu的时间的话就可以自己传入手机时间的数值

比如我要手机1分钟的数据,则只需要localhost:8080/debug/pprof/profile?seconds=60.这样的话,程序就会进入60秒的cpu收集时间,等到收集完成后,会返回一个profile的二进制文件,我们可以给重命名为cpu.pprof,然后就可以使用go tool pprof cpu.pprof 来进行性能分析了。

同理内存分析可以通过访问localhost:8080/debug/pprof/heap

通过命令行来分析

可以通过命令收集cpu

go tool pprof http://localhost:8080/debug/pprof/profile

同样可以进行数据收集,当然,可以后面设置参数(--seconds 25表示设置25秒),默认是30秒的收集时间。收集完成后悔进入pprof模式下

也可以通过命令收集内存go tool pprof http://localhost:8080/debug/pprof/heap

pprof文件分析

接下来就是重点,如何分析我们pprof文件:

在进入pprof状态之后,可以使用top命令来查看,最耗费资源的是哪些函数

这里分析下各个参数的意思

flat和cum:

Flat表示给定函数的持续时间,cum表示当前函数的累加调用。 比如有一个函数a()调用函数b()和函数c(),

函数b()耗时1秒,函数b()耗时两秒,那么cum就是1+2=3s

flat表示的是a()函数自己耗费的时间

如果a()函数是这样的

1
2
3
b() // takes 2s
do something directly // takes 3s
c() // takes 2s

那么a函数的cum值是6秒,flat是3秒(假设do something directly里面没有函数调用)

sum:

要理解sum需要看上图,第一个sum是25%和flat的25%是相同的,然后第二个sum是50%,是第一个flat的25%加上第二个flat的25%,以此类推。

具体可以参考:

What is the meaning of “flat” and “cum” in golang pprof output

图形分析

只是通过top命令来查看分析数据的话,太过抽象也不好分析,go tool pprof中也有工具可以把生成的pprof文件转换成图形工具,但是需要事先安装 graphviz 。

安装好之后可以直接使用命令来生成图片

1
2
3
4
5
[root@iZbp14ouog5ocoeakj39q1Z guess]# go tool pprof  cpu.pprof
Entering interactive mode (type "help" for commands)
(pprof) svg
Generating report in profile001.svg
(pprof)

这样就生成了svg图片profile001.svg

由于我代码中并没有写太多的业务逻辑,所以这里可以看到大部分的耗时多事发生在运行时,四个耗时25%的函数是runtime.memmove runtime.memeqbody runtimecgocall runtime.stdcall.接下来,可以根据图形具体分析程序在哪里耗费资源然后进行优化

火焰图

上图的结构给我们的是晦涩难懂的感觉,我们需要寻求更直观,更简单的分析工具。而且使用火焰图不需要安装graphviz

go-torch是Uber公司开源的一款针对Go语言程序的火焰图生成工具,能收集 stack traces,并把它们整理成火焰图,直观地程序给开发人员。

go-torch是基于使用BrendanGregg创建的火焰图工具生成直观的图像,很方便地分析Go的各个方法所占用的CPU的时间, 火焰图是一个新的方法来可视化CPU的使用情况,本文中我会展示如何使用它辅助我们排查问题。

安装

1.首先,我们要配置FlameGraph的脚本

FlameGraph 是profile数据的可视化层工具,已被广泛用于Python和Node

1
git clone https://github.com/brendangregg/FlameGraph.git

2.检出完成后,把flamegraph.pl拷到我们机器环境变量$PATH的路径中去,例如:

1
cp flamegraph.pl /usr/local/bin

3.在终端输入 flamegraph.pl -h 是否安装FlameGraph成功

1
2
3
4
5
6
7
8
9
10
11
12
13
14
15
16
17
18
19
20
21
22
23
24
$ flamegraph.pl -h
Option h is ambiguous (hash, height, help)
USAGE: /usr/local/bin/flamegraph.pl [options] infile > outfile.svg

--title # change title text
--width # width of image (default 1200)
--height # height of each frame (default 16)
--minwidth # omit smaller functions (default 0.1 pixels)
--fonttype # font type (default "Verdana")
--fontsize # font size (default 12)
--countname # count type label (default "samples")
--nametype # name type label (default "Function:")
--colors # set color palette. choices are: hot (default), mem, io,
# wakeup, chain, java, js, perl, red, green, blue, aqua,
# yellow, purple, orange
--hash # colors are keyed by function name hash
--cp # use consistent palette (palette.map)
--reverse # generate stack-reversed flame graph
--inverted # icicle graph
--negate # switch differential hues (blue<->red)
--help # this message

eg,
/usr/local/bin/flamegraph.pl --title="Flame Graph: malloc()" trace.txt > graph.svg

4.安装go-torch

有了flamegraph的支持,我们接下来要使用go-torch展示profile的输出,而安装go-torch很简单,我们使用下面的命令即可完成安装

1
go get -v github.com/uber/go-torch

5.使用go-torch -h命令:可以查看go-torch的帮助文档,这里我们根据生产的cpu.pprof文件,通过使用go-torch 命令来生成火焰图

1
2
3
$ go-torch -b cpu.pprof -f cpu.svg
INFO[12:38:16] Run pprof command: go tool pprof -raw cpu.pprof
INFO[12:38:16] Writing svg to cpu.svg
  • -b:表示需要被转换成svg的二进制文件
  • -f:表示要生成的svg图片名称

此时已经将cpu.pprof生成了cpu.svg的火焰图了,可以通过浏览器查看

这就是go-torch生成的火焰图,看起来是不是舒服多了。

  • 火焰图的y轴表示cpu调用方法的先后,比如:bufio.(*Writer).Flush是由net/http.(*chunkWriter).writenet/http.CheckConnErrorWriter.Writer两个函数组成的。
  • x轴表示在每个采样调用时间内,方法所占的时间百分比,越宽代表占据cpu时间越多

有了火焰图,我们就可以更清楚的看到哪个方法调用耗时长了,然后不断的修正代码,重新采样,不断优化。

参考:

Go代码调优利器-火焰图

Golang性能调优(go-torch, go tool pprof)

golang-http包

http服务

http包包含http客户端和服务端的实现,利用Get,Head,Post,以及PostForm实现HTTP或者HTTPS的请求.

1. 函数

1.1 服务端函数

  1. Handle将handler按照指定的格式注册到DefaultServeMux,ServeMux解释了模式匹配规则

    1
    func Handle(pattern string, handler Handler)
  2. HandleFunc同上,主要用来实现动态文件内容的展示,这点与ServerFile()不同的地方。

    1
    func HandleFunc(pattern string, handler func(ResponseWriter, *Request))
  3. ServeFile利用指定的文件或者目录的内容来响应相应的请求.

    1
    func ServeFile(w ResponseWriter, r *Request, name string)
  4. ListenAndServe监听TCP网络地址addr然后调用具有handler的Serve去处理连接请求.通常情况下Handler是nil,使用默认的DefaultServeMux

    1
    func ListenAndServe(addr string, handler Handler) error

1.2最简单的http服务

1
2
3
4
5
6
7
package main

import "net/http"

func main() {
http.ListenAndServe(":8080", nil)
}

访问网页后会发现,提示的不是“无法访问”,而是”页面没找到“,说明http已经开始服务了,只是没有找到页面
由此可以看出,访问什么路径显示什么网页 这件事情,和ListenAndServe的第2个参数有关

由1.1的解析可知,第2个参数是一个 Hander

在http包中看到这个 Hander接口只有一个方法ServeHTTP

1
2
3
type Handler interface {
ServeHTTP(ResponseWriter, *Request)
}

所以只要实现了ServeHTTP(ResponseWriter, *Request)这个方法的struct,那么就可以将这个struct方法放进去,然后被调用

ServeHTTP方法,他需要2个参数,

  1. 一个是http.ResponseWriter, 往http.ResponseWriter写入什么内容,浏览器的网页源码就是什么内容
  2. 另一个是http.Request,http.Request里面是封装了浏览器发过来的请求(包含路径、浏览器类型等等)

example

1
2
3
4
5
6
7
8
9
10
11
12
13
14
15
16
package main

import (
"io"
"net/http"
)

type test struct{}
//结构体a实现了ServeHTTP
func (*test) ServeHTTP(w http.ResponseWriter, r *http.Request) {
io.WriteString(w, "hello world")
}

func main() {
http.ListenAndServe(":8080", &test{})//第2个参数需要实现Hander的struct,a满足
}

现在
访问localhost:8080的话,可以看到“hello world”
访问localhost:8080/abc的话,可以看到“hello world”
访问localhost:8080/123的话,可以看到“hello world”
事实上访问任何路径都是“hello world”

当 http.ListenAndServe(“:8080”, &test{})后,开始等待有访问请求

一旦有访问请求过来,http包回去调用test的ServeHTTP这个方法。并把自己已经处理好的http.ResponseWriter, *http.Request传进去

而test的ServeHTTP这个方法,拿到*http.ResponseWriter后,并往里面写东西,客户端的网页就显示出来了

一、从源码可以理解:这里会将Handler赋值给Server

1
2
3
4
5
// ListenAndServe always returns a non-nil error.
func ListenAndServe(addr string, handler Handler) error {
server := &Server{Addr: addr, Handler: handler}
return server.ListenAndServe()
}

二、

这里是server.ListenAndServe()———–>回去调用go c.server(ctx)

其中c是c := srv.newConn(rw)

然后c.server(ctx)这个函数中会调用serverHandler{c.server}.ServeHTTP(w, w.req)这个方法

这里serverHandler组合了Server结构体

这里当handler为空的时候就调用默认的DefaultServeMux,当不为空的时候就会去调用handler.ServeHTTP

1
2
3
4
5
6
7
8
9
10
11
12
13
14
15
16
// serverHandler delegates to either the server's Handler or
// DefaultServeMux and also handles "OPTIONS *" requests.
type serverHandler struct {
srv *Server
}

func (sh serverHandler) ServeHTTP(rw ResponseWriter, req *Request) {
handler := sh.srv.Handler
if handler == nil {
handler = DefaultServeMux
}
if req.RequestURI == "*" && req.Method == "OPTIONS" {
handler = globalOptionsHandler{}
}
handler.ServeHTTP(rw, req)
}

通过上面的解析就可以知道网页解析是通过调用ServeHTTP方法来的

###2.3、ServeMux的作用

先看ServeMux的结构体:

1
2
3
4
5
6
7
8
9
10
11
type ServeMux struct {
mu sync.RWMutex
m map[string]muxEntry
hosts bool // whether any patterns contain hostnames
}

type muxEntry struct {
explicit bool
h Handler
pattern string
}

从结构体中可以看出ServeMux有一个map属性,map属性的value是个muxEntry类型,这个类型中有一个Handler属性,可以推测看看此ServerMux的m属性的key保存的是url,muxEntry是一个Handler方法

然后看代码

1
2
3
4
5
6
7
8
9
10
11
12
13
14
15
16
17
package main

import (
"net/http"
"io"
)

type b struct{}

func (*b) ServeHTTP(w http.ResponseWriter, r *http.Request) {
io.WriteString(w, "hello")
}
func main() {
mux := http.NewServeMux()//新建一个ServeMux。
mux.Handle("/h", &b{})//注册路由,把"/"注册给b这个实现Handler接口的struct,注册到map表中。
http.ListenAndServe(":8080", mux)
}

mux.Handle内部

1
2
3
4
5
6
7
8
9
10
11
12
13
14
15
16
17
18
19
20
21
22
23
24
25
26
27
//Handle registers the handler for the given pattern.
// If a handler already exists for pattern, Handle panics.
func (mux *ServeMux) Handle(pattern string, handler Handler) {
mux.mu.Lock()
defer mux.mu.Unlock()

if pattern == "" {
panic("http: invalid pattern " + pattern)
}
if handler == nil {
panic("http: nil handler")
}
if mux.m[pattern].explicit {
panic("http: multiple registrations for " + pattern)
}

if mux.m == nil {
mux.m = make(map[string]muxEntry)
}
//将路由作为key,然后将handler和路由以及显示调用设置为true
mux.m[pattern] = muxEntry{explicit: true, h: handler, pattern: pattern}

if pattern[0] != '/' {
mux.hosts = true
}
....
}

所以可以看出ServeMux是通过一个map将路由以及函数存起来的。

1
func (mux *ServeMux) Handle(pattern string, handler Handler) {}

这个函数接收的第一个参数是路由,第二个参数是一个Handler。这个Handler和上面ListenAndServe的第二个参数是一样的是只有一个ServeHTTP(ResponseWriter, *Request)方法的接口。所以此处的handler需要实现ServeHTTP方法。

运行时,因为第二个参数是mux,所以http会调用mux的ServeHTTP方法。ServeHTTP方法执行时,会检查map表(表里有一条数据,key是“/h”,value是&b{}的ServeHTTP方法)

如果用户访问/h的话,mux因为匹配上了,mux的ServeHTTP方法会去调用&b{}的 ServeHTTP方法,从而打印hello
如果用户访问/abc的话,mux因为没有匹配上,从而打印404 page not found

2.4、ServeMux的HandleFunc方法

ServeMux有一个HandleFunc方法,此方法直接调用handle函数并实现了ServeHTTP

1
2
3
func (mux *ServeMux) HandleFunc(pattern string, handler func(ResponseWriter, *Request)) {
mux.Handle(pattern, HandlerFunc(handler))
}
1
2
3
4
5
6
type HandlerFunc func(ResponseWriter, *Request)

// ServeHTTP calls f(w, r).
func (f HandlerFunc) ServeHTTP(w ResponseWriter, r *Request) {
f(w, r)
}

所以使用HandlerFunc的时候

1
2
3
4
5
6
7
8
9
10
11
12
13
14
15
16
17
18
19
20
21
22
package main

import (
"net/http"
"io"
)

func main() {
mux := http.NewServeMux()
mux.HandleFunc("/h", func(w http.ResponseWriter, r *http.Request) {
io.WriteString(w, "hello")
})
mux.HandleFunc("/bye", func(w http.ResponseWriter, r *http.Request) {
io.WriteString(w, "byebye")
})
mux.HandleFunc("/hello", sayhello)
http.ListenAndServe(":8080", mux)
}

func sayhello(w http.ResponseWriter, r *http.Request) {
io.WriteString(w, "hello world")
}

Go单元测试

为什么需要单元测试

开发程序其中很重要的一点是测试,我们如何保证代码的质量,如何保证每个函数是可运行,运行结果是正确的,又如何保证写出来的代码性能是好的,我们知道单元测试的重点在于发现程序设计或实现的逻辑错误,使问题及早暴露,便于问题的定位解决。对一个包做(单元)测试,需要写一些可以频繁(每次更新后)执行的小块测试单元来检查代码的正确性。于是我们必须写一些 Go 源文件来测试代码。测试程序必须属于被测试的包,并且文件名满足这种形式 *_test.go,所以测试代码和包中的业务代码是分开的。

Go语言中自带有一个轻量级的测试框架testing和自带的go test命令来实现单元测试和性能测试,testing框架和其他语言中的测试框架类似,你可以基于这个框架写针对相应函数的测试用例。

_test 程序不会被普通的 Go 编译器编译,所以当放应用部署到生产环境时它们不会被部署;只有 gotest 会编译所有的程序:普通程序和测试程序。

另外建议安装gotests插件自动生成测试代码:

1
go get -u -v github.com/cweill/gotests/...

go单元测试的命令是

go test

go test 只会输出错误的信息,想要看详细的信息使用go test -v

Go的自带单元测试的编写

1、如何编写测试用例

接下来我们在该目录下面创建两个文件:even.go和oddeven_test.go
even.go:

1
2
3
4
5
6
7
8
9
10
/*
用来测试前 100 个整数是否是偶数。这个函数属于 even 包。
*/
package even
func Even(i int) bool {
return i%2 == 0
}
func Odd(i int) bool {
return i%2 != 0
}

oddeven_test.go:这是我们的单元测试文件,

1.1测试文件的规则:

  1. 文件名必须是_test.go结尾的,这样在执行go test的时候才会执行到相应的代码
  2. 你必须import testing这个包
  3. 所有的测试用例函数必须是Test开头
  4. 测试用例会按照源代码中写的顺序依次执行
  5. 测试函数TestXxx()的参数是testing.T,我们可以使用该类型来记录错误或者是测试状态
  6. 测试格式:func TestXxx (t *testing.T),Xxx部分可以为任意的字母数字的组合,但是首字母不能是小写字母[a-z],例如Testintdiv是错误的函数名。
  7. 函数中通过调用testing.TError, Errorf, FailNow, Fatal, FatalIf方法,说明测试不通过,调用Log方法用来记录测试的信息。

oddeven_test.go

1
2
3
4
5
6
7
8
9
10
11
12
13
14
15
16
17
18
19
20
21
22
23
24
25
26
package even
import "testing"
func TestEven(t *testing.T) {
if !Even(10) { //!Even(10)==false,不会向下执行
t.Log("10 must be even")
t.Fail()
}
if Even(7) {
t.Log("7 is not even")
t.Fatal()
}
if Even(10) { //Even(10)==true,但是为了测试,让它执行t.Log()和 t.Fail()
t.Log("Everything OK: 10 is even, just a test to see failed output!")
t.Fail()
}
}
func TestOdd(t *testing.T) {
if !Odd(11) {
t.Log(" 11 must be odd!")
t.Fail()
}
if Odd(10) {
t.Log(" 10 is not odd!")
t.Fail()
}
}

使用go test 运行oddeven_test.go,只会出现错误信息

— FAIL: TestEven (0.00s)

1
2
> oddeven_test.go:16: Everything OK: 10 is even, just a test to see failed output!
>

FAIL
exit status 1
FAIL MyStudy/GolangTest/even 0.364s

使用go test -v,会将详细的信息都打印出来,通过的会有pass标识

=== RUN TestEven
— FAIL: TestEven (0.00s)

1
2
> oddeven_test.go:16: Everything OK: 10 is even, just a test to see failed output!
>

=== RUN TestOdd
— PASS: TestOdd (0.00s)
FAIL
exit status 1
FAIL MyStudy/GolangTest/even 0.397s

1.2单元测试的一些通知失败的方法

1)func (t *T) Fail()

1
标记测试函数为失败,然后继续执行(剩下的测试)。

2)func (t *T) FailNow()

1
标记测试函数为失败并中止执行;文件中别的测试也被略过,继续执行下一个文件。

3)func (t *T) Log(args ...interface{})

1
args 被用默认的格式格式化并打印到错误日志中。

4)func (t *T) Fatal(args ...interface{})

1
结合 先执行 3),然后执行 2)的效果。

GoGonvey框架写单元测试

1、GoGonvey框架介绍

Go 语言虽然自带单元测试功能,在 GoConvey 诞生之前也出现了许多第三方辅助库。但没有一个辅助库能够像 GoConvey 这样优雅地书写代码的单元测试,简洁的语法和舒适的界面能够让一个不爱书写单元测试的开发人员从此爱上单元测试。

1.1、GoGonvey的优点

  1. GoConvey支持Go的本机testing包。无论是网页界面还是DSL都不需要; 你可以独立使用任何一个。
  2. GoConvey集成后**go test**,您可以在终端中继续运行测试或者使用自动更新Web UI进行测试。
  3. GoConvey还有web UI可以来方便查看代码覆盖率,以及单元测试错误信息

1.2、安装GoGonvey

1
go get github.com/smartystreets/goconvey

1.3、快速开始一个例子

写一个oddeven_goconvey_test.go 文件,将test.go改写成convey形式的

1
2
3
4
5
6
7
8
9
10
11
12
13
14
15
16
17
18
19
20
21
22
23
24
25
26
27
28
package even

import (
. "github.com/smartystreets/goconvey/convey"
"testing"
)

func TestEvenConvey(t *testing.T) {
Convey("Given some integer with a starting value", t, func() {
Convey("When the integer is even", func() { //第一个Convey需要t参数,以后的不需要了
Convey("10 must be even", func() {
b := Even(10)
So(b, ShouldBeTrue)
})

Convey("7 is not even", func() {
b := Even(7)
So(b, ShouldBeFalse)
})

Convey("Everything OK: 10 is even, just a test to see failed output!", func() {
b := Even(10)
So(b, ShouldBeFalse)
})

})
})
}

使用 GoConvey 书写单元测试,每个测试用例需要使用Convey函数包裹起来。它接受的第一个参数为 string 类型的描述;第二个参数一般为*testing.T,即本例中的变量 t;第三个参数为不接收任何参数也不返回任何值的函数(习惯以闭包的形式书写)。

Convey语句同样可以无限嵌套,以体现各个测试用例之间的关系,例如TestEvenConvey函数就采用了嵌套的方式体现它们之间的关系。需要注意的是,只有最外层的Convey需要传入变量 t,内层的嵌套均不需要传入

最后,需要使用So语句来对条件进行判断。在本例中,我们只使用了 2 个不同类型的条件判断:ShouldBeTrue和ShouldBeFalse,分别表示值应该为 true、值应该false。

常用的有

  1. ShouldEqual: 表示值应该想等
  2. ShouldResemble: 进行深度相同检查,要有两个值So(b, ShouldResemble, true)
  3. ShouldBeTrue: 表示值应该为true
  4. ShouldBeZeroValue:表示值应该为0
  5. ShouldNotContainSubstring:接收2字符串参数并确保第一个不包含第二个字符串。
  6. ShouldPanic: 表示值应该panic

有关详细的条件列表,可以参见官方文档

1.4、运行测试

1.4.1、go test -v运行

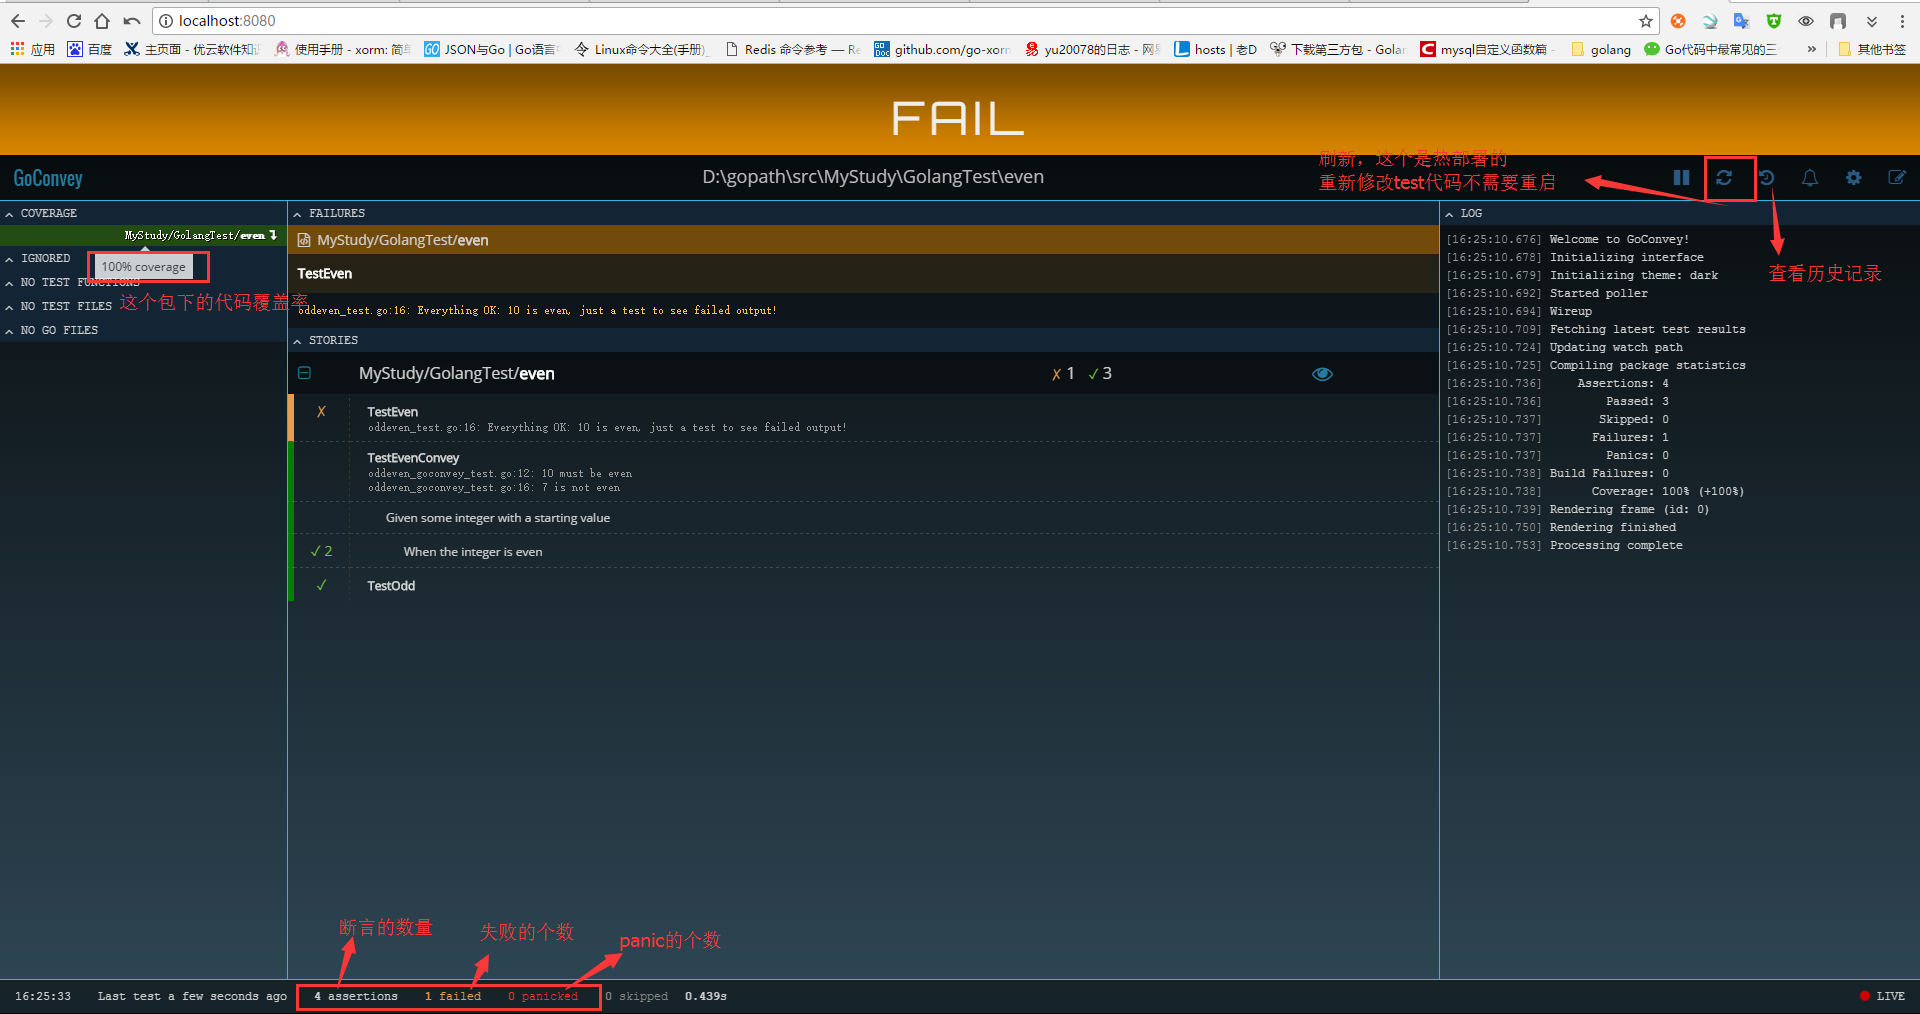
现在,可以打开命令行,然后输入go test -v来进行测试。由于 GoConvey 兼容 Go 原生的单元测试,因此我们可以直接使用 Go 的命令来执行测试。

=== RUN TestEvenConvey

Given some integer with a starting value
When the integer is even
10 must be even .
7 is not even .
Everything OK: 10 is even, just a test to see failed output! x

Failures:

D:/gopath/src/MyStudy/GolangTest/even/oddeven_goconvey_test.go

Line 23:

1
2
3
> Expected: false
> Actual: true
>

3 total assertions

— FAIL: TestEvenConvey (0.00s)
FAIL
exit status 1
FAIL MyStudy/GolangTest/even 0.401s

可以看到给出的信息比go自带的测试包多很多信息

1.4.2、goconvey 运行测试

web界面查看数据

GoConvey 不仅支持在命令行进行人工调用调试命令,还有非常舒适的 Web 界面提供给开发者来进行自动化的编译测试工作。在项目目录下执行goconvey 同时可以打开浏览器查看localhost:8080

解析上面图片

1.5、GoConvey的一些功能

测试自动运行

只需保存.go文件或单击图标执行测试。您的浏览器页面将自动更新。

覆盖报告

可以点击左上角的软件包名称来查看Go的详细HTML覆盖率报告

黑暗,光和自定义主题

GoConvey内置了两个主题。(在此页面上切换主题以尝试!)您还可以使用第三方主题或自己滚动。

暂停,恢复和审查

可以暂停自动测试执行,并查看最近的测试历史,以查看代码在何处,何时以及为什么中断。

在 Web 界面中,您可以设置界面主题,查看完整的测试结果,使用浏览器提醒等实用功能。

其它功能:

  1. 自动检测代码变动并编译测试
  2. 半自动化书写测试用例:http://localhost:8080/composer.html
  3. 查看测试覆盖率:http://localhost:8080/reports/
  4. 临时屏蔽某个包的编译测试

defer和追踪

defer关键字

关键字 defer 允许我们推迟到函数返回之前(或任意位置执行 return 语句之后)一刻才执行某个语句或函数(为什么要在返回之后才执行这些语句?因为 return 语句同样可以包含一些操作,而不是单纯地返回某个值)。

关键字 defer 的用法类似于面向对象编程语言 Java 和 C# 的 finally 语句块,它一般用于释放某些已分配的资源。

示例 6.8 defer.go

1
2
3
4
5
6
7
8
9
10
11
12
13
14
15
16
package main
import "fmt"

func main() {
function1()
}

func function1() {
fmt.Printf("In function1 at the top\n")
defer function2()
fmt.Printf("In function1 at the bottom!\n")
}

func function2() {
fmt.Printf("function2: Deferred until the end of the calling function!")
}

输出:

1
2
3
In Function1 at the top
In Function1 at the bottom!
Function2: Deferred until the end of the calling function!

请将 defer 关键字去掉并对比输出结果。

使用 defer 的语句同样可以接受参数,下面这个例子就会在执行 defer 语句时打印 0

1
2
3
4
5
6
func a() {
i := 0
defer fmt.Println(i)
i++
return
}

当有多个 defer 行为被注册时,它们会以逆序执行(类似栈,即后进先出):

1
2
3
4
5
func f() {
for i := 0; i < 5; i++ {
defer fmt.Printf("%d ", i)
}
}

上面的代码将会输出:4 3 2 1 0

关键字 defer 允许我们进行一些函数执行完成后的收尾工作,

例如:

  1. 关闭文件流:

    // open a file
    defer file.Close() (详见第 12.2 节)

  2. 解锁一个加锁的资源

    mu.Lock()
    defer mu.Unlock() (详见第 9.3 节)

  3. 打印最终报告

    printHeader()
    defer printFooter()

  4. 关闭数据库链接

    // open a database connection
    defer disconnectFromDB()

合理使用 defer 语句能够使得代码更加简洁。

以下代码模拟了上面描述的第 4 种情况:

1
2
3
4
5
6
7
8
9
10
11
12
13
14
15
16
17
18
19
20
21
22
23
24
25
26
27
package main

import "fmt"

func main() {
doDBOperations()
}

func connectToDB() {
fmt.Println("ok, connected to db")
}

func disconnectFromDB() {
fmt.Println("ok, disconnected from db")
}

func doDBOperations() {
connectToDB()
fmt.Println("Defering the database disconnect.")
defer disconnectFromDB() //function called here with defer
fmt.Println("Doing some DB operations ...")
fmt.Println("Oops! some crash or network error ...")
fmt.Println("Returning from function here!")
return //terminate the program
// deferred function executed here just before actually returning, even if
// there is a return or abnormal termination before
}

输出:

1
2
3
4
5
6
ok, connected to db
Defering the database disconnect.
Doing some DB operations ...
Oops! some crash or network error ...
Returning from function here!
ok, disconnected from db

使用 defer 语句实现代码追踪

一个基础但十分实用的实现代码执行追踪的方案就是在进入和离开某个函数打印相关的消息,即可以提炼为下面两个函数:

1
2
func trace(s string) { fmt.Println("entering:", s) }
func untrace(s string) { fmt.Println("leaving:", s) }

以下代码展示了何时调用两个函数:

示例 6.10 defer_tracing.go:

1
2
3
4
5
6
7
8
9
10
11
12
13
14
15
16
17
18
19
20
21
22
23
package main

import "fmt"

func trace(s string) { fmt.Println("entering:", s) }
func untrace(s string) { fmt.Println("leaving:", s) }

func a() {
trace("a")
defer untrace("a")
fmt.Println("in a")
}

func b() {
trace("b")
defer untrace("b")
fmt.Println("in b")
a()
}

func main() {
b()
}

输出:

1
2
3
4
5
6
entering: b
in b
entering: a
in a
leaving: a
leaving: b

上面的代码还可以修改为更加简便的版本(示例 6.11 defer_tracing2.go):

1
2
3
4
5
6
7
8
9
10
11
12
13
14
15
16
17
18
19
20
21
22
23
24
25
26
27
package main

import "fmt"

func trace(s string) string {
fmt.Println("entering:", s)
return s
}

func un(s string) {
fmt.Println("leaving:", s)
}

func a() {
defer un(trace("a"))
fmt.Println("in a")
}

func b() {
defer un(trace("b"))
fmt.Println("in b")
a()
}

func main() {
b()
}

使用 defer 语句来记录函数的参数与返回值

下面的代码展示了另一种在调试时使用 defer 语句的手法(示例 6.12 defer_logvalues.go):

1
2
3
4
5
6
7
8
9
10
11
12
13
14
15
16
17
package main

import (
"io"
"log"
)

func func1(s string) (n int, err error) {
defer func() {
log.Printf("func1(%q) = %d, %v", s, n, err)
}()
return 7, io.EOF
}

func main() {
func1("Go")
}

输出:

1
Output: 2011/10/04 10:46:11 func1("Go") = 7, EOF
|